Performance Review
Following four consecutive positive quarters dating back to June of 2020, US equities appeared to be in line to continue the streak as stocks rose through July and August, before cooling off and pulling back over the month of September. While the streak technically continues, US equities (as represented by the S&P 500 below) finished the quarter up just 0.05%. International equities (represented by the MSCI ACWI Ex USA index below) continued their streak of lagging the US market, finishing the quarter down -2.96%. Somewhat surprisingly, the US Bond Market (Bloomberg Barclays US Aggregate index below) led this quarter (albeit just slightly), returning 0.10%. Year-to-date, US equities have still led the way by a significant margin (15.92%), followed by International equities (5.90%), and bonds in a distant third (-1.55%).
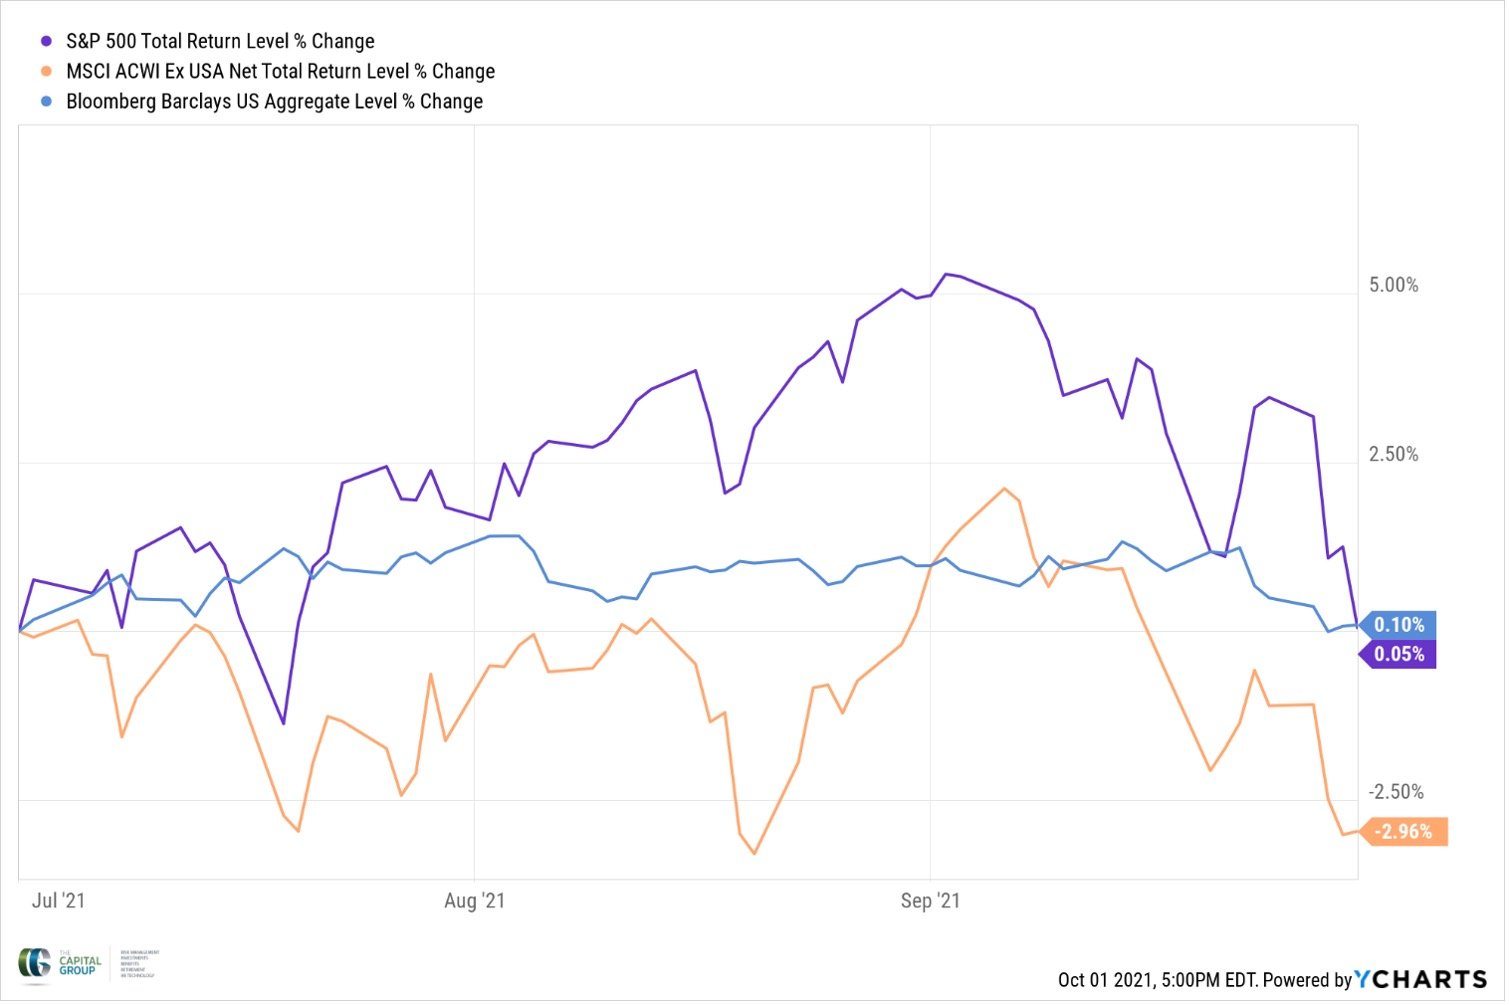
Recent concerns ranging from COVID cases to Debt-Ceiling crises led the US stock market to pull-back over September, finishing the quarter flat
Revisiting Last Quarter’s “Shift in Sentiment”
At the end of the second quarter, I wrote about how there appeared to have been a shift in sentiment across the US stock market. Not only had Small stocks outperformed Large companies:
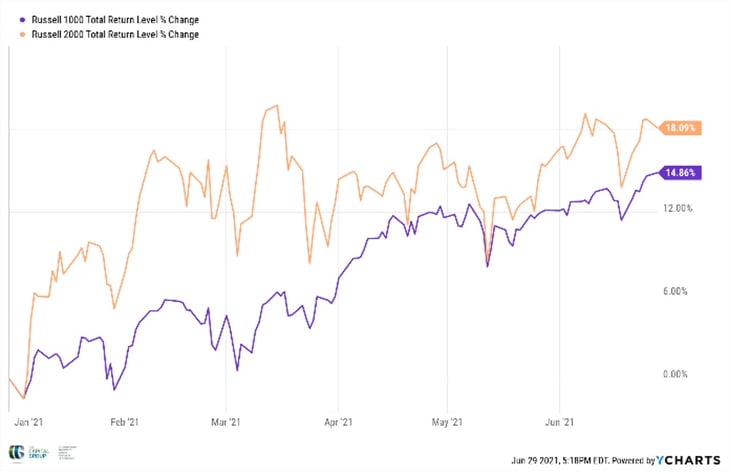
At the end of the second quarter, the trend of Large companies outperforming Small companies appeared to have reversed.
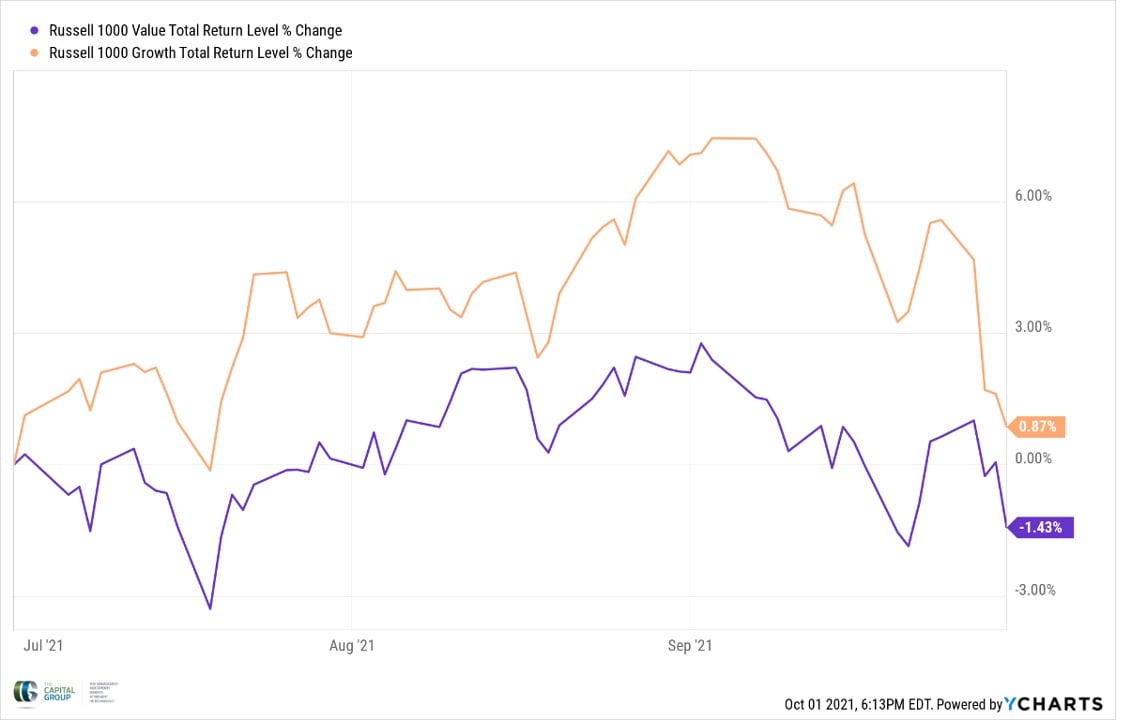
but Value-oriented companies had also reversed the long-standing trend of lagging Growth-oriented companies:
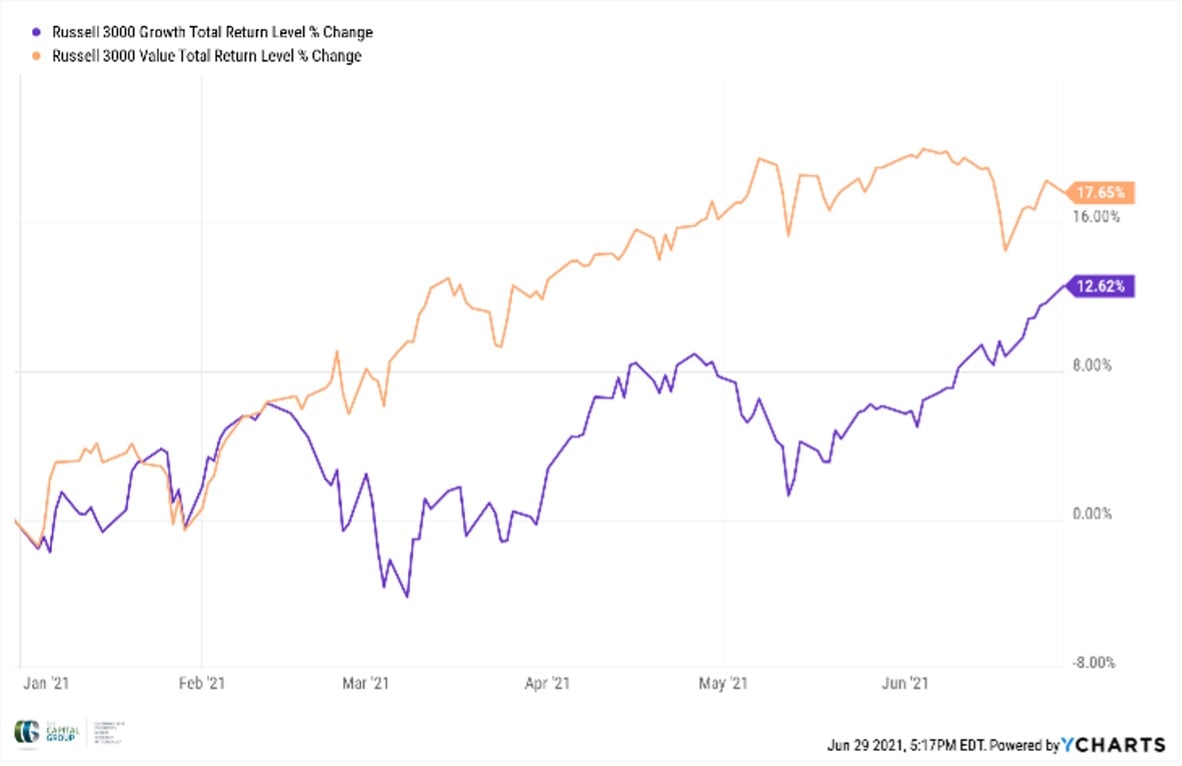
The story was the same for the Value/Growth trend. Value appeared to finally be winning
At the time, I commented on how amusing this was, given that at any point over the past decade, a Google search could yield a compelling case for the continuation or reversal of either trend. I also explained that two quarters is really no trend at all and that it remained to be seen whether these recent reversals would persist. Right on cue, both trends reversed course almost immediately following last quarter’s market update.
Large companies outperformed Small by a significant margin in the third quarter and now lead for the year:
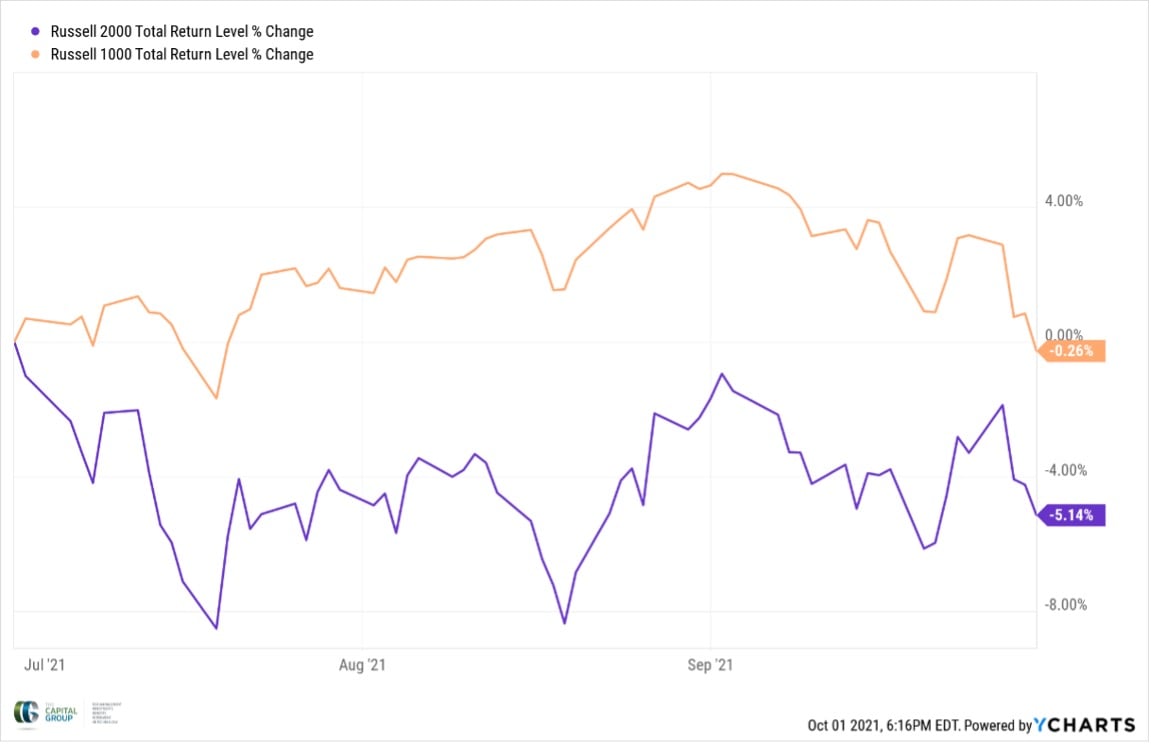
and Growth outperformed Value (though it still trails year-to-date)
All that is to say: monitoring and commenting on changing trends like Small/Large and Value/Growth takes up a lot of the collective focus of the Financial Markets Commentariat, but the impacts of such trends are minimal over the long run to a diversified investor. With exposure to Value, Growth, Small, and Large companies, the impact of these short-term changes shrinks to almost nothing.
Economic Landscape
Last quarter, we were left hoping the third quarter would provide clarity on three questions:
Economic Growth
1. Will the economy continue to grow on pace with its previous trend?
Amidst rising COVID cases and supply chain constraints, GDP growth disappointed in the 2nd quarter, rising by an annualized rate of 6.5% against expectations of 8.4%. Though disappointing, some noted (through rosier glasses) that the economy grew at its fastest pace since Fall of 2020, reaching its pre-pandemic level (though it remained below Potential GDP):
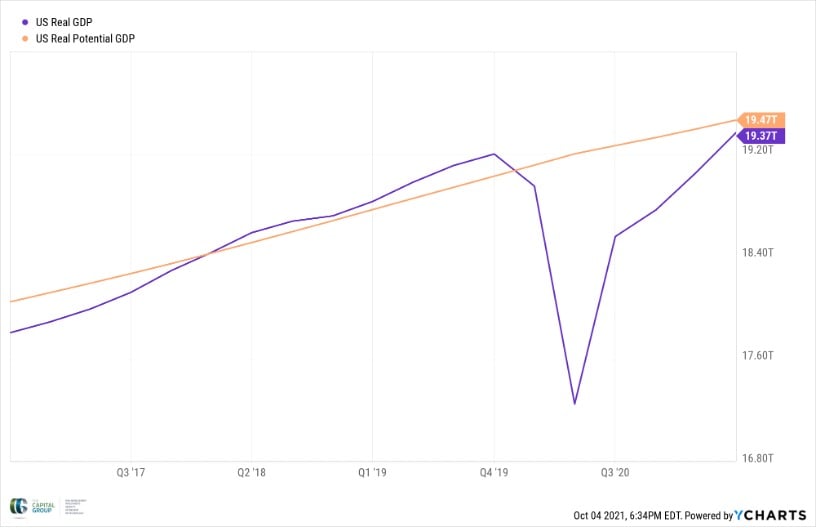
Adjusted for inflation, the economy grew past its pre-pandemic high in the second quarter, though still lagged behind its potential
The space between GDP and its potential is often referred to as the Output Gap, which measures how the economy is doing compared to a hypothetical stable economy with a “high rate of use of its capital and labor resource.” The existence of a positive gap indicates that the economy is not quite back on its pre-COVID track.
Employment Scenario
2. Will the employment picture become rosier, or will the supply of labor continue to lag the white-hot demand?
The third quarter brought volatile employment reports, ranging from optimistic outperformance to shocking underperformance, to somewhere in between. July saw the hottest job growth since the pandemic began, August initially reported a significant miss of just 235,000 jobs (that was later revised upwards to a more middling 366,000 jobs), and September brought a dismal 194,000 jobs, well below an anticipated 500,000 number.
Though the unemployment rate actually declined last month, this was mostly a mathematical quirk that is a function of a workforce declining at a faster rate than the new jobless claims coming in. With extended unemployment benefits running out around the country, many commentators believed we would see significant job increases, but it still appears at this point that the fear of the Delta variant is more of a deterrent to rejoining the workforce than previously anticipated. With supply chains already stretched thin driving prices upwards, a dearth of labor will only drive these prices up further as employers are forced to compete for the same workers. This remains one of the most important economic stories to monitor going forward as we enter a fourth quarter filled with seasonal increases of demand for goods and services across the economy.
Inflation
3. Will we continue to see accelerating inflation, or will it turn out to be transitory, after all?
The “is inflation transitory?” debate rages on. Jerome Powell remains committed to keeping interest rates low even as inflation remains above target, as he still remains convinced inflation is temporary and will pass. However, some have noted a slight change in messaging with the Fed’s recent announcement that it may begin to taper its asset-purchasing program as soon as November (along with some slight concessions from Powell himself late last week that continued inflation is “frustrating”). Looking at the breakdown of GDP we examined last quarter, it is not hard to see what is sparking the change of sentiment:
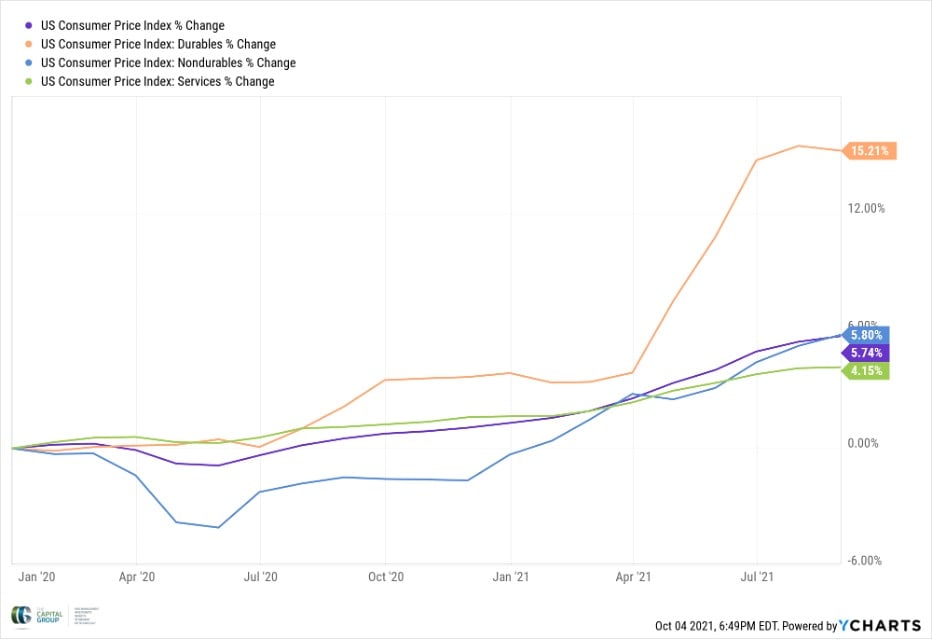
Inflation in Durable Goods has finally begun to plateau, while prices of both Non-Durable Goods and Services have started to increase, continuing CPI’s upwards trend.
Durable goods inflation, which was the main driver of overall inflation when we examined the breakdown last quarter, has flattened out and is beginning to slow (albeit slightly). This is a good sign for overall inflation. What is unfortunate is that everything else (nondurables and services) are now growing more rapidly. The main concern here is that when these categories – Food, House Supplies, Clothing, etc. – drive inflation, everybody feels it and it can have more widespread economic effects. If everyone begins to feel inflation, the Fed may be forced to act, which would have significant implications for the markets.
Looking Forward
The increased demand for goods and services that the holidays bring should provide an interesting test for our current economic situation. Will there be enough goods to buy or will demand far outstrip the supply, continuing the upwards push in inflation? Will the need to buy more goods and services tip the scales for those still sitting on the sideline waiting to reenter the labor market? How will the equity markets respond to the continued uncertainty? These are just some of the big questions to monitor as 2021 begins to wind down.
As always, feel free to reach out to myself or the rest of the team if you would like to explore any of this further.
The above writing does not constitute investment advice, rather they are general guidelines and/or for informational purposes. Before acting on any analysis, advice, or recommendation in the above content, you should seek the personalized advice of legal, tax, or investment professionals. This page includes links to external websites over which The Capital Group has no control. The Capital Group provides no warranties as to the content or accessibility of the website and assumes no liability for errors or reporting inaccuracies reflected therein. The Capital Group has neither approved nor endorsed the statements made by the site. For more information about The Capital Group Investment Advisory Services, LLC and our investment philosophy, including information on fees, you may request a copy of our Form ADV Part 2A from our team at RIAInbox@capgroupfinancial.com.


